The Path to Renewal

The degree of disruption suffered by the design and construction industries over the previous 24 months is well documented: Tens of thousands of jobs have been lost in the design industry, in addition to over 2 million job losses in the construction industry. It is a seismic shift in the labor force of industries coping with the financial crisis of 2008 and the economic crisis of 2009. Many in the industry have hunkered down, reduced ambition and shrunk their workforce to await the day they can get back to normal. This strategy could be summarized as: Recognize that something has changed, choose to ignore it and hope for the best.
“The only man I know who behaves sensibly is my tailor; he takes my measurements anew each time he sees me. The rest go on with their old measurements and expect me to fit them.” — George Bernard Shaw

As George Bernard Shaw suggests, it is time to measure and adjust to fit the new normal. While the job losses in the design and construction industry are well-reported, little documentation accounts for how the customers of these firms are faring. In this vein, FMI and the Construction Management Association of America (CMAA) sought to shed some light in this dark corner.
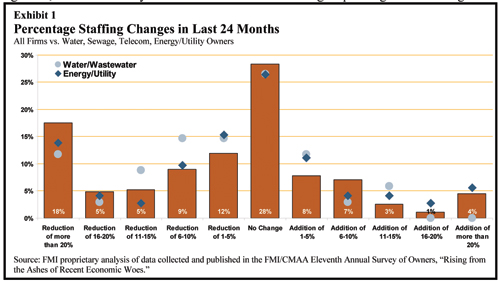
Exhibit 1 describes an environment in which 18 percent of all owners or buyers of construction services surveyed reported job reductions greater than 20 percent in their planning, design and construction execution staff. In total, over 50 percent of these firms reported significant but lesser reductions in staff. Energy/utility owners, one of the best performing construction segments, faired reasonably well with more firms than average reporting gains in staffing and a smaller than average number reporting reductions greater than 10 percent. Water and sewage utilities have not fared as well. Many municipal owners are reporting planning, design and construction execution staffing reductions in the 1 to 15 percent range at a much higher rate than other types of owners. Reports that there will likely be further staffing cuts by municipal- and state-level owners in late 2010 and 2011 perhaps reveal a situation in which these organizations were not sufficiently aggressive with staffing changes and will have to make further reductions.
The doom and gloom of this particular analysis is balanced by more positive news, or what we refer to as the “phoenix rising.” The legend of the phoenix is one of renewal and rebirth; so too will the utility construction industry return to health and vigor. Several areas of opportunity were identified through the study:
- Future hiring by owners will look different due to shifts in the economic landscape:
- 15 percent expect to hire from design or construction firms;
- 10 percent expect to hire less-expensive staff;
- 8 percent will hire retirees to work part time;
- And 7 percent will retain current staff beyond their expected retirement dates.
- Program management use has doubled since 2007 to support construction programs with smaller numbers of in-house staff.
- Pockets of prosperity exist:
- 15 percent of all owners and 16 percent of energy/utility owners increased staff by greater than 5 percent in the last 24 months.
- Options abound for designers and contractors to offer owners staff augmentation and additional high-quality experts as services.
- Publicly traded owners are hoarding cash that will be turned into capital investment and ultimately design and construction activity.
As designers and contractors look forward, it is critical that they recognize the changed environment that utility owners face and decipher how to offer value-added services that may not necessarily look like the services offered prior to 2009.
Utility Construction Spending Forecast
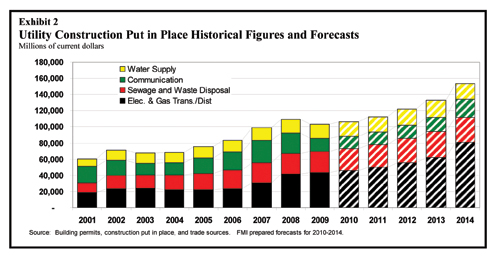
Overall, FMI expects 2011 to show a modest 2 to 3 percent improvement over 2009 and 2010 figures. Utility spending represents, possibly, the best performing segment in the United States, although it may not feel like that for the firms that work in it due to increased competition and price pressure. Communication, water and sewage will all exhibit very slow growth while electric, gas and liquid transmission and distribution are the healthiest.
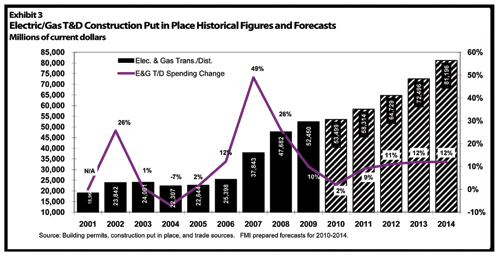
Transmission and Distribution
Much attention has been given to the unbalanced growth among the sub-sectors of transmission and distribution construction. Congress’ inability to pass any comprehensive energy legislation in 2010 has stalled the industry and had many owners sitting on their hands and waiting for the outcome of the November elections. This gridlock will likely continue as the Republicans take control of the House of Representatives and more seats in the Senate. Despite this discouraging outlook for construction spending, it is our belief that continued growth in this sector will take place, albeit not the eye-popping growth rates of 2002, 2007 and 2008.
Subsectors in this market, along with FMI’s perspectives on how they are likely to perform in 2011, include the following.
- Electric transmission: Higher growth rates to meet renewable power generation integration, reliability and system capacity requirements.
- Electric distribution: Variable growth dependent on geography, system age and replacement/renewal programs within service territory; new home related construction is very low.
- Gas distribution: An unbalanced growth rate of 3 to 5 percent, depending on geographic region and the existence of programs driving replacement or renewal of existing infrastructure.
- Gas submarkets/gathering: Nationwide, it peaked in 2007/2008 with flat or slow growth. Until gas prices rebound, small regions will experience higher growth rates tied to specialized shale gas plays or positioning for future pipeline capacity.
- Gas transmission: Growth of 6 to 10 percent, mostly in large, long-duration projects.
- Liquids transportation: Growth in a wide range of 3 to 8 percent, dependent on oil above $60 per barrel and regulatory pressure to purchase liquids from North American sources.
Water Supply, Sewage and Waste Disposal
In the context of capital construction, both water supply and sewage and waste disposal are highly interrelated. The vast majority of the water and wastewater systems across the United States are municipally operated, aging and require extensive maintenance and/or new capital spending. The municipal operation of these systems ties them directly to the financial performance of both the municipal and state coffers that are the primary means of revenue and, ultimately, capital expenditures. The weakness of both municipal and state funding sources along with the potential for limited federal funding to close these gaps dictate lower growth rates until 2012 or beyond.
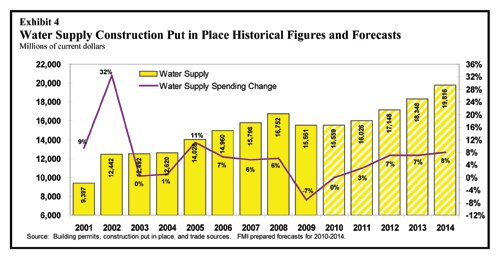
In Exhibit 4, water supply construction experienced a significant drop-off in 2009, more than we had anticipated last year at this time for 2010. Growth in 2010 is essentially non-existent and we do not anticipate more aggressive growth until at least 2012. At this point, the housing crisis and state and municipal budget issues are likely to have improved or, ideally, been fully resolved.
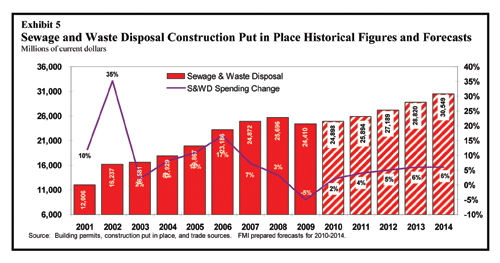
In Exhibit 5, sewage and waste disposal shows a similar trend with a very low 2008 growth rate and a drop in 2009. 2010 shows a slight increase driven by a combination of special funding and judicial requirements. The drop in this sector is not as severe as that shown in water supply, in part due to regulatory pressure that requires expenditures to meet consent decree requirements or other legislative, judicial or regulatory imperatives. Based upon FMI’s preliminary research, at least 20 municipalities are operating under significant judicial consent decrees, amounting to a potential spend of $15+ billion over the next decade.
This figure alone accounts for between 3 and 5 percent of all spending in the sewage and waste disposal sector over this time period.

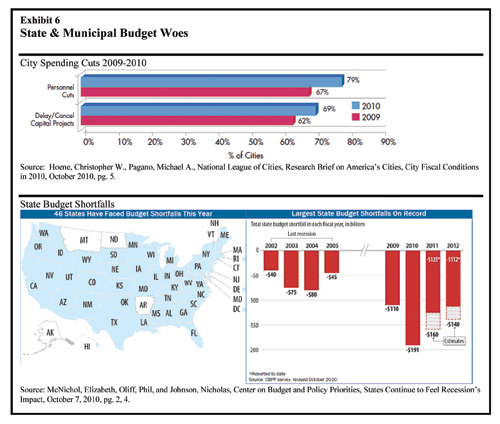
The most significant challenge for both water and sewage is not demand, as this is both significant and increasing. The challenge is finding the funding. To provide a frame of reference for this challenge, some startling statistics on the financial health of both states and municipalities are listed below and in Exhibit 6.
- Water/Wastewater utilities are reporting an average of 5 percent reduction in capital planning, design and construction execution staff over the previous 24 months and 55 percent of all water or sewage utility owners report a smaller but still significant staff reduction.
- Between July 1, 2009, and November 18, 2009, roughly $1.7 billion in municipal bonds defaulted.
- Thirty-five municipal bond issues totaling $1.5 billion defaulted in the first six months of 2010.
- Delay or cancellation of capital spending is the second most frequent form of budget control implemented at the municipal level and 69 percent of municipalities are using it.
- Nearly nine in 10 city finance officers report that their cities are less able to meet fiscal needs in 2010 than in the previous year — financial officers report the largest spending cuts and loss of revenue in the 25-year history of the National League of Cities survey.
- Forty-six states are operating with 2011 budget shortfalls.
- The 2010 and 2011 budget shortfalls are the largest on record and two to three times higher than the last recessionary period at the start of the decade.
Ultimately, both of these markets will demonstrate only modest growth until the funding conundrum is resolved through new taxes, higher user fees or alternative funding that masks tax and rate increases.
Communications
The communications sector continues to exhibit some of the highest volatility in capital construction spending of all sectors reported. Both 2009 and 2010 were anticipated to be very challenging construction environments with significant reductions in spending. It turns out that while both years did see significant reductions in spending, they were somewhat buoyed by a combination of stimulus spending and pressure applied by both market forces and the National Broadband Plan initiatives. Some statistics:
- Broadband penetration across all U.S. homes exceeds 66 percent.
- Globally, 172 million smart phones were sold during 2009, up 24 percent from 2008 with growth of 50 percent already recorded through 2nd Quarter 2010.
- Google plans to build experimental, ultra high-speed broadband networks that will produce internet speeds more than 100 times faster than what most Americans have access to today with 1 gigabit per second, fiber-to-the-home connections.
- Security-related spending is a driver for the foreseeable future: The share of cyber-security spending in total federal IT spending will grow from 10.5 percent in 2010 to 11.3 percent in 2015. The largest spenders in civilian agencies will be the departments of Health and Human Services, Homeland Security, Treasury, Transportation, Veterans Affairs and Justice.
- In the utility world today, there are few topics as hot, though confusing, as the smart grid. With companies like Cisco predicting the underlying communications network will be “100 or 1,000 times larger than the internet,” there is good reason to be excited.
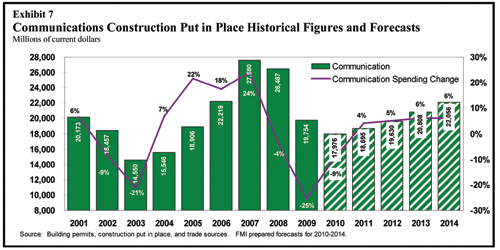
In Exhibit 7, the 2011 forecast exhibits some improvement in spending, but only returning the market to 2005 levels. Broadly speaking, the demand for communication services, and ultimately the construction that makes them possible, is becoming more price inelastic. This is a fancy way to say that the desire for these services somewhat trumps income changes and general economic growth. As the use and penetration of high bandwidth applications and a meeting of the communications grid and power grid takes place to allow the implementation of smart grid applications, growth in this market, albeit volatile, will continue. (Note: Please see Exhibit 8 for a description of smart grid applications and note that nearly all of them require some significant level of data movement requiring high bandwidth applications.)
Our forecast in Exhibit 7 shows a leveling of growth beyond 2011. It is possible that this market will become more stable from a capital construction standpoint and avoid the severe five- to seven-year cycles it has historically exhibited. For this next cycle, our forecasts are probably too conservative, as this market has not demonstrated anything close to this level of stable growth since as far back as 1995. It is more likely that market will accelerate aggressively in favored sub-segments, resulting in big winners and losers in terms of operating companies, equipment, business model and the like. Designers and contractors in this space will be challenged with either trying to pick these winners and losers or alternatively spreading the bets across multiple firms with multiple business models and multiple equipment platforms. Both approaches present significant strategy and market positioning challenges for these firms. Guidance through the maze and effective risk management are critical.
Conclusion
Utility construction owners have reacted to a prolonged economic downturn. Like a phoenix rising, the reactions will both drive change and create opportunity for the designers and contractors that serve them. Among other changes, owners have increased their exploration of alternate project delivery methods and use of program management and re-evaluated their approach to contracting and procurement.
One recession consequence with a critically important long-term impact has been the diminution of owners’ construction and program management staffs. How this significant disruption will play out is largely unknown, but it will surely drive change. We have not seen this magnitude of job loss or disruption in the construction industry since the mid-1980s, over a generation ago. Given the staffing changes experienced by owners, eliminating waste and fully leveraging the existing low resource levels is likely the order of business for the next two years.
As financing has become ever more difficult and projects were deferred or cancelled, many owners opted to let job vacancies go unfilled (attrition) or to reduce their workforces more actively by layoffs, early retirements and similar processes. As long as the flow of projects remains depressed by economic conditions, then a rough balance of resources and demand is maintained. In the future, however, owners by and large do not anticipate returning to their full pre-recession staffing levels; in fact, many do not expect to hire at all within the next two to three years.
This trend threatens to leave owners inadequately equipped to deal with any significant number of new project launches. Faced with more work than in-house staff can handle, little prospect of expanding that staff, and increasing regulatory and reliability mandates, owners will need to identify additional resources to help them fulfill their organization’s business objectives.
These are the new measurements for your customers and markets. Build your service set to offer them the highest value and as George Bernard Shaw suggested, “behave sensibly!”
Mark Bridgers is a consultant with FMI Corp., which provides management consulting, training and investment banking services to the worldwide construction industry. He can be reached at MBridgers@fminet.com. For more information on FMI, visit www.fminet.com.
- FMI proprietary analysis of data collected and published in the FMI/CMAA Eleventh Annual Survey of Owners, “Rising from the Ashes of Recent Economic Woes.”
- Rose, Jeff, Municipal Budget Woes Return, Nov. 18, 2009 (https://www.goodfinancialcents.com/municipal-bondsbudget-woes-return/).
- Preston, Darrell, Bloomberg, Municipal Bond Defaults Continue at Triple the Typical Rate, Lehmann Says, July 16, 2010.
- Hoene, Christopher W., Pagano, Michael A., National League of Cities, Research Brief on America’s Cities, City Fiscal Conditions in 2010, October 2010, pg. 5.
- Ibid., pg. 2.
- McNichol, Elizabeth, Oliff, Phil, and Johnson, Nicholas, Center on Budget and Policy Priorities, States Continue to Feel Recession’s Impact, October 7, 2010, pg. 2.
- Ibid., pg. 4.
- Smith, Aaron, “Home Broadband 2010,” Pew Research Center’s Internet & American Life Project, Aug. 11, 2010, pg. 2.
- Gartner Press Release, Gartner Says Worldwide Mobile Phone Sales to End Users Grew 8 Per Cent in Fourth Quarter 2009; Market Remained Flat in 2009, February 23, 2010.
- Duncan, Geoff, Android Sees Huge Market Growth in Second Quarter, Digital Trends, Aug. 12, 2010 (https://www.digitaltrends.com/mobile/android-sees-huge-market-growth-in-second-quarter/).
- Google Fiber for Communities: Next steps, https://www.google.com/appserve/fiberrfi.
- Market Research Media, U.S. Federal Cybersecurity Market Forecast 2010-2015, August 2010.
- “Wiser Wires,” The Economist, Oct. 10, 2009, Page 71.
Comments are closed here.